The Report Builder is a comprehensive and flexible interface designed to build full-featured reports.
|
Note: |
|
The Report Builder is not designed to build or modify dashboards. |
Hover the mouse over the Add button and select Report from the dropdown list to access the Report Builder.
Navigating the Report Builder
Following is a high level overview of the Report Builder and the various components and options. The details of each component are covered elsewhere in this document.
The core steps in the building of a report involve:
These steps will be exercised in this section just to show the navigation options.
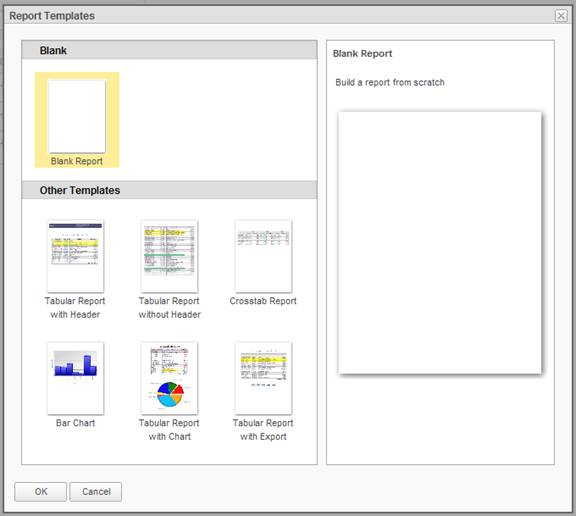
After clicking the Add / Report option, a template selection dialog will be presented.
Six templates are included in addition to the Blank template The Blank template is initially selected. Click on a template and then click on the OK button.
The Select or Modify Data Source dialog will be presented to allow the user to determine the data objects on which the report will be based.
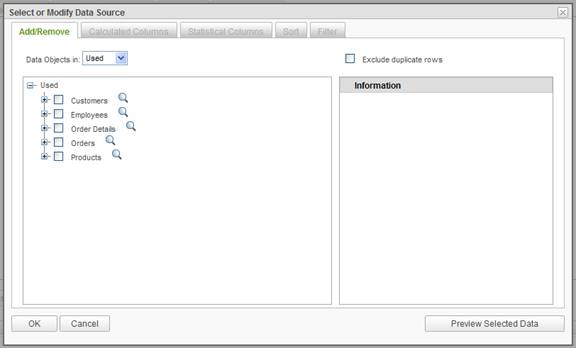
The Add/Remove tab allows the user to select all of the data objects that form the basis of the report. Until data objects have been selected for the report the other tabs will be disabled. The Calculated Columns tab allows the user to create custom columns. The Statistical Columns tab may be selected to do cursory analysis of the data. The Sort tab determines the initial sort sequence of the data returned from the reporting database. The Filter tab allows the user to specify filter criteria for the data.
The list of data objects available to the user may be filtered by the Data Objects in dropdown list. These are categories of data objects.
The data objects tree identifies the data objects available
to the end user. As objects are selected the tree will be refreshed to show the
related data objects. The columns of a data object can be viewed by expanding
the data object. Sample data for the object can be displayed by clicking on the
![]() icon.
icon.
The Information panel will display any helpful descriptions of the data object or column that the mouse is on.
The Preview Selected Data button will display a report dialog based on the data objects selected. From this dialog the selections can be confirmed and all of the dialogs dismissed.
The OK button saves the currently selected data objects and dismisses the dialog.
Once the data objects for the report have been selected, the full Report Builder interface is available.
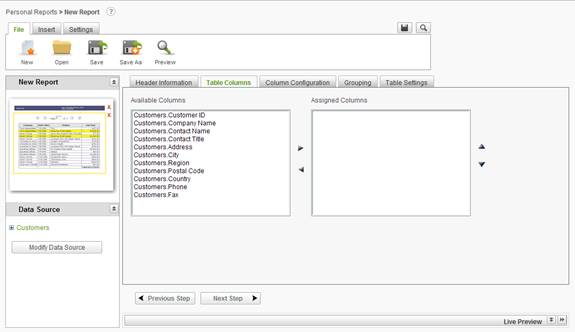
Across the top of the page is the breadcrumb trail, a series of links to the pages and folders recently visited.
![]()
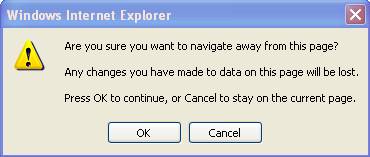
For example, clicking on Personal Reports link in the breadcrumb trail will display the Reports page. If changes to the report have not been saved, the following confirmation dialog will be displayed:
The tabbed function ribbon follows with File, Insert, and Settings tabs.
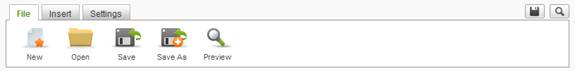
The File options are generally related to the report definition files. From this set of options you can create a new report, open an existing report, save the report definition, save the report definition by a new name or preview the current report.
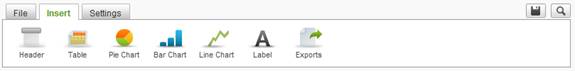
The Insert options are related to display elements. The options presented in this ribbon are configurable by the administrator. The display elements may be added to the report by either clicking on the display element or drag-and-drop to a location in the Report Layout panel.
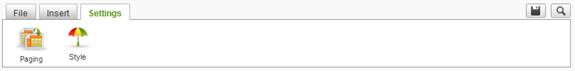
The Settings options allow the user to control the paging aspects of the report as well as select the stylesheet to be used to render the report.
Quick shortcuts are provided to save the current report
definition and preview the report via the ![]() and
and ![]() icons, respectively.
icons, respectively.
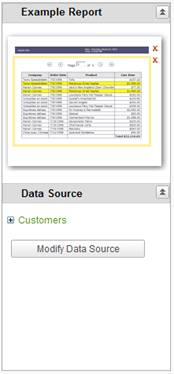
On the left side of the page below the function ribbons are the Report Layout and Data Source panels.
 The Report
Layout panel displays thumbnails of the display elements in the sequence
defined in the report. Display elements may be removed by clicking on the
The Report
Layout panel displays thumbnails of the display elements in the sequence
defined in the report. Display elements may be removed by clicking on the ![]() icon.
Display elements may be added or rearranged by drag-and-drop methods. Clicking
on the display element in the Report Layout panel will open the configuration
page for the display element.
icon.
Display elements may be added or rearranged by drag-and-drop methods. Clicking
on the display element in the Report Layout panel will open the configuration
page for the display element.
The Data Source panel displays the defined sources of data for the report. Data objects, calculated columns and statistical columns are listed. The Modify Data Source button will display the Select or Modify Data Source dialog.
Either panel may be collapsed or expanded by clicking on the
![]() or
or
![]() buttons.
buttons.
Centered on the page is the tabbed Configuration panel. Each tab allows the end user to configure some aspect of a display element. Every display element will have at least one configuration tab associated with it.
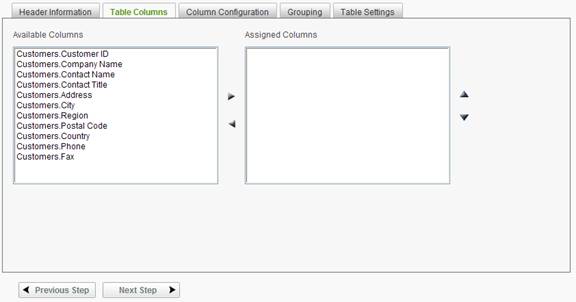
As display elements are added to the report, the number of configuration tabs will grow. When the number of tabs exceeds the page width, the tabs become scrollable.
![]()
Clicking on the ![]() or
or ![]() arrows will scroll the
tabs left and right.
arrows will scroll the
tabs left and right.
The Previous Step and Next Step buttons will display the contents of the previous or next configuration tab in the Configuration panel. Hovering the mouse over the buttons will display a tooltip describing the action.
At the bottom of the page is the Live Preview panel that will show the report as it being developed. As changes are made to the configuration, the impact on the report can be viewed live .
![]()
This panel is initially collapsed. Click on the ![]() or
or ![]() buttons
to collapse or expand the panel in the current browser window. Click on the
buttons
to collapse or expand the panel in the current browser window. Click on the ![]() to
display the report preview in a separate browser window.
to
display the report preview in a separate browser window.
|
Note: |
|
The Live Preview is refreshed with each change to the report configuration. The preview is a full rendering of the display element as it would appear in the report. Rendering the display element will impact the performance of the Report Builder, particularly for large volumes of data. |
|
Notes: |
|
1. When creating a report, the Live Preview panel will not begin displaying anything until a Data Object has been selected. 2. When exiting the Report Builder, the Ad Hoc will remember the state in which the Live Preview panel was last in, expanded or collapsed. Therefore, upon the next launching of the Report Builder, non-specific to any report, the Ad Hoc will display the Live Preview panel in the viewable state it was last in. 3. If the Live Preview feature is not offered in the Report Builder, contact the System Administrator to enable it. |
|
Note: |
|
After an extended period of inactivity, the web server will end a browser session and work may be lost. It is a good idea to save report modifications often to avoid this scenario. |