![]()
The Interactive Data View (IDV) is an analysis tool included with the application, and provides a versatile way to interact with data in a chart or table. The IDV chart can display data in a table, pie chart, grid chart, line chart or area chart. Use the IDV to perform quick calculations on the data or create "what-if" scenarios by filtering columns out of the report.
|
Note: |
|
IDV Charts require the Java Runtime Engine browser plug-in. The JRE can be downloaded from ahIDVs.files\download.jsp. |
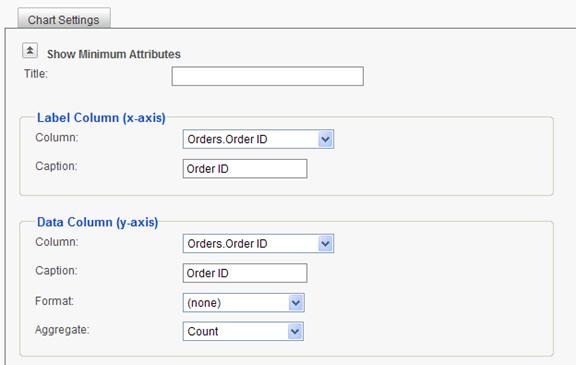
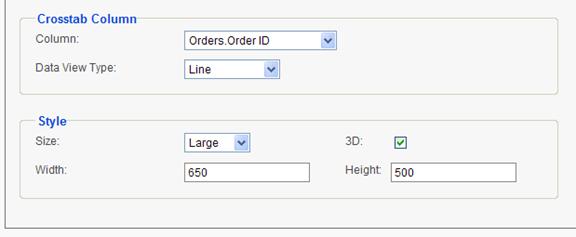
The Report Builder provides a wizard for configuring the IDV; however, most of these settings only apply to the initial view of the IDV. The IDV is a highly interactive and dynamic reporting component, and most of these options can be changed after it loads in the browser.
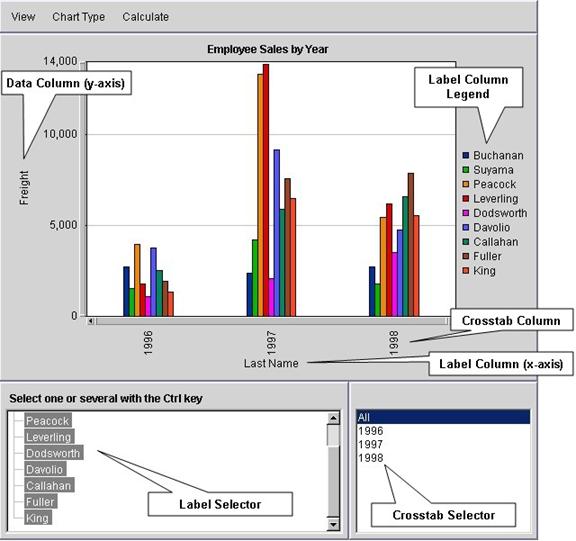
The Interactive Data View interface.
Filter the Crosstab and Label Columns:
The IDV provides the Label Selector and Crosstab Selector to dynamically filter data presented in the data view. Select a single record or hold CTRL to select multiple records. The IDV is updated each time a record is selected or removed.
Find Data Values:
Move the cursor over an item in the label column to see all the corresponding data values from the data column.
The data values for Leverling are displayed across the IDV.
Alternatively, an individual element can be selected to view its associated label. Move the cursor across the chart to view individual data values.
Scale the Chart:
The IDV chart is automatically scaled to view all records in the crosstab column (x-axis). The crosstab column may contain hundreds of records, causing an undesirable data view.
|
|
|
|
|
|
Sliding the horizontal scrollbar creates a more desirable data view.
The View menu provides other ways to dynamically change the way data is displayed in the chart. Data can be presented in table form, chart form and chart/table form. Other flexible view options include transposing the x- and y-axes, reversing the columns and restoring the initial order.
Transpose the X- and Y-Axes:
|
|
|
|
|
|
Transposing the x- and y-axes swaps the label and crosstab columns.
The IDV allows the user to dynamically swap the label and crosstab columns without modifying the chart from the Report Builder.
Sort the Data Table:
From the Table view, users can sort records in the data column for each record in the crosstab column.
Values for 1998 are dynamically sorted in descending order.
Click the column headers to sort the data in ascending or descending order.
The Chart Type menu gives users the ability to visualize data using different types of charts. Charts are either 2D or 3D and are one of the following:
|
|
|
|
|
|
|
|
|
|
The Calculate menu provides several functions to perform calculations on the IDV. The calculations available are: